
Mi activity
I’ve worn a Mi Band almost every day since 2016, and now all ten years of it are on one page: Mi activity
 Mi activity logo
That comes to 3,927 days of data and 21,308,308 steps, which is roughly 14,500 km, or about 5,400 steps a day on average. The best day was 26 May 2019 with 31,130 steps.
The page shows steps, sleep, resting heart rate, weight and workouts. The main view is a calendar of daily steps with one row and one colour per year, where a darker cell means more steps, so busy summers and quiet winters stand out right away. Below it are steps by year, month and weekday, sleep duration and the usual bedtime and wake-up time, resting heart rate and weight trends (with the pregnancy period marked), workouts by type, personal records, and a table with all the numbers. Use the tabs at the top or the ← / → keys to switch years.
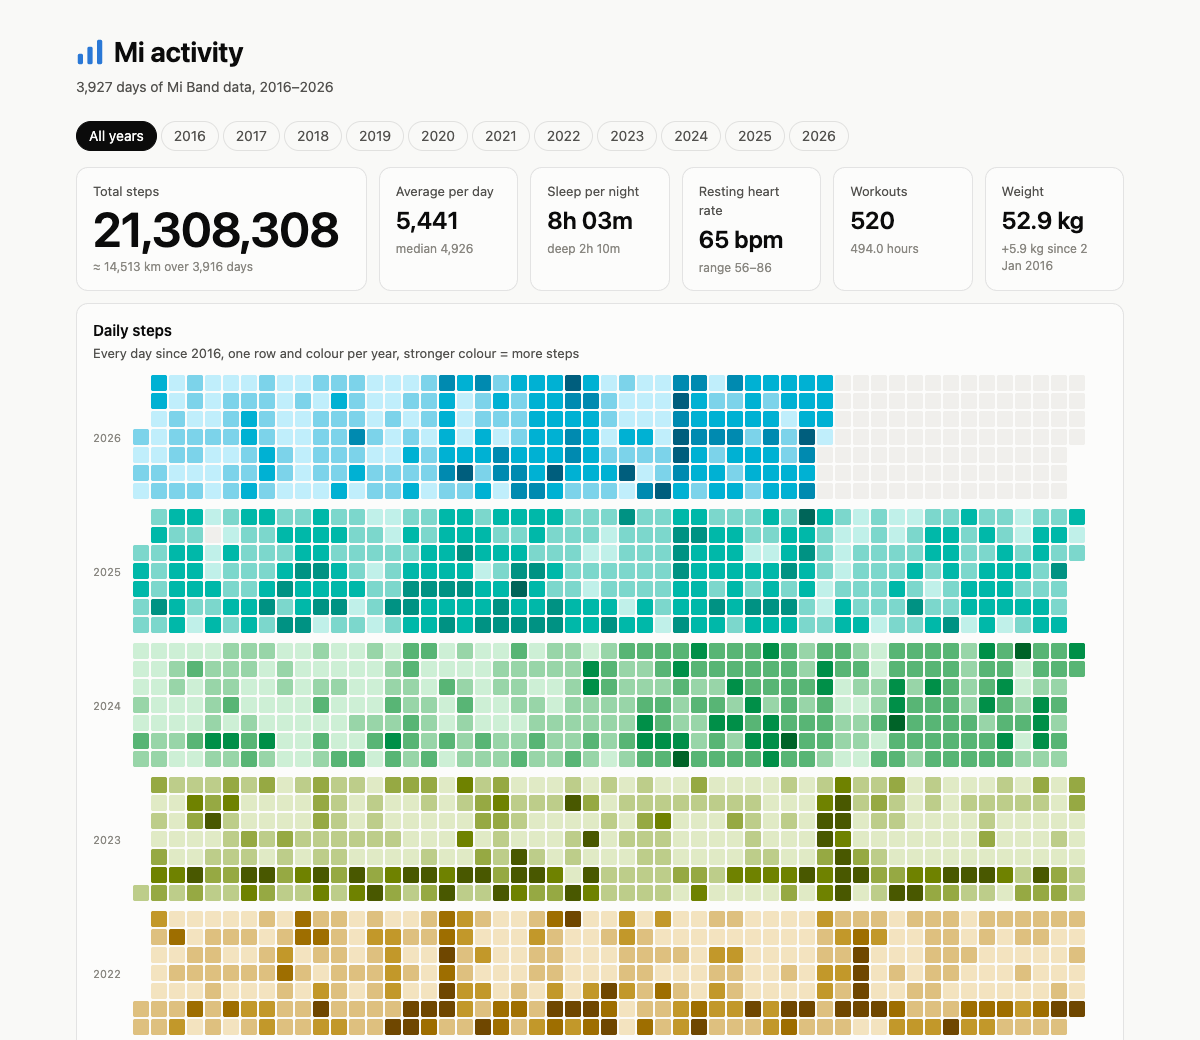 Ten years of daily steps
Getting the data together took the most work. Over the years the bracelets synced to two different apps, Mi Fit / Zepp and later Mi Fitness, and the two exports overlap and don’t use the same format. A small Python script merges them into one set of CSV files, one folder per year. Where both apps have the same day, the Mi Fitness value is used. Times are converted using the UTC offset I was actually in, so trips show up correctly, and weigh-ins from other people on the shared scale are removed. A second script builds a single static index.html from those CSVs. All charts are hand-written SVG with no libraries, and they work in light and dark mode and on phones.
The data has some limits. Heart rate only starts in September 2018, because the earlier bands didn’t measure it. Calories are left out because older and newer bands count them so differently that the numbers can’t be compared. Nights shorter than 2 hours or longer than 14 hours are dropped, since those are usually a band lying on the nightstand being scored as sleep.
I made it together with Claude Code.